A Modified Shapefile for Plotting Swiss Cantons
The GADM database of Global Administrative Areas is the place to go for shapefiles of administrative boundaries. The data are freely available for academic use and other non-commercial use. Unfortunately, the boundaries of the Swiss cantons are a bit buggy. Version 2 has fixed the presence of a 27th canton — part of Lake Geneva, but it includes the entire lake of any lake shared with a neighbouring country as Swiss territory.
The licence of the GADM files is never made explicit, and while the about page says “Please contribute in whatever way you can by sending us a message to point out errors, or even better, to send an improved file for a country of your interest,” there is no way to send improved files on their website. I never got replies to my messages, so consider this post as my sending an improved file.
The files are on Codeberg. I have modified cantonal boundaries so that they match the national boundaries: only the Swiss part of lakes is included as Swiss territory. I’m not sure the files other than the .shp, .shx, .dbf, .prj are actually needed.
Here’s how to draw a map in R. First we load two libraries:
library(sp)

library(rgdal)
Then we import the shapefile:
x <- readOGR(dsn = ".", layer = "ch-cantons")
The dsn argument takes the location of the shapefile (dot for current directory); the layer argument takes the name of the shapefile without extensions.
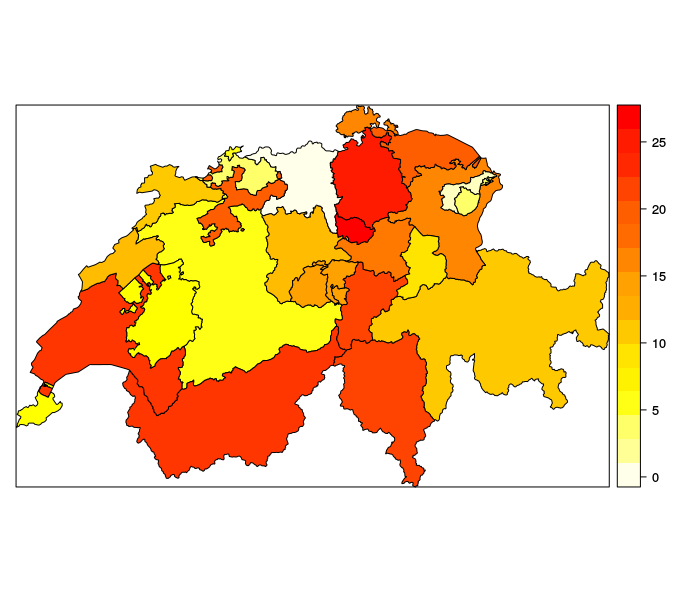
And now we draw the map:
data <- 1:26 # values to plot

x$data <- data # add to SpatialPolygonsDataFrame

col <- rev(heat.colors(26)) # define colours

spplot(x, "data", col.regions=col, main="", colorkey=TRUE)
Published 21 November 2015 · updated 1 October 2025 · updated 3 March 2026