Plotting a normal distribution in R
Apparently there are some unnecessarily complicated tutorials out there how to draw a normal distribution (or other probability distributions) in R. No, there is no need for a loop; in fact, a single line of code is enough:
curve(dnorm(x, 0, 1), from=-4, to=4)
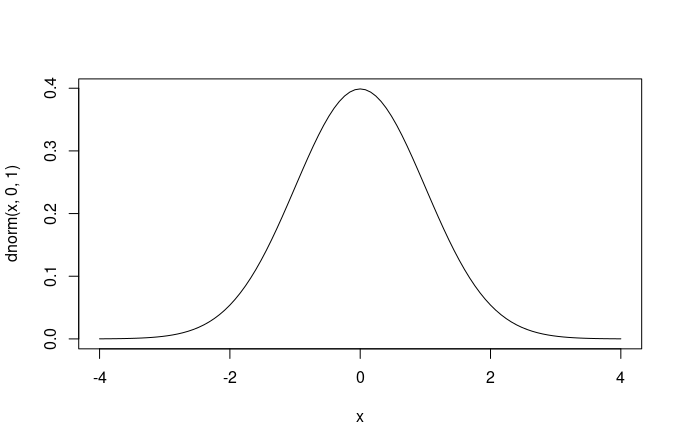
That’s a normal probability distribution with mean 0 and a standard deviation 1, plotted from -4 to +4.
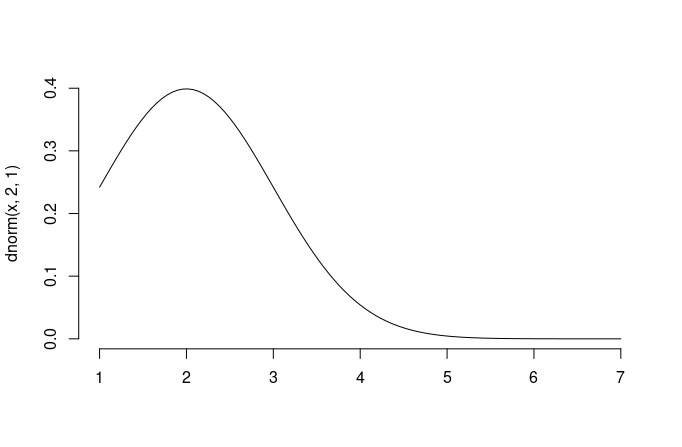
So it’s also easy to draw normal distributions with different means or different standard deviations. Here’s one without a box around:
curve(dnorm(x, 2, 1), from=1, to=7, bty="n", xlab="")
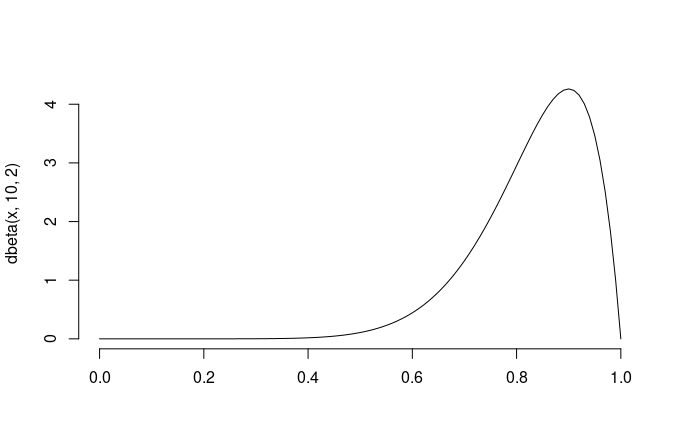
How about a beta distribution? It’s not more difficult (assuming you know your shape parameters):
curve(dbeta(x, 10, 2), from=0, to=1, bty="n", xlab="")
So from now on, if you need to visualize your priors to get a feel whether they constitute reasonable distributions, remember it’s just one line in R.
Published 27 November 2021