Stacked barplot for only one categorical variable in R
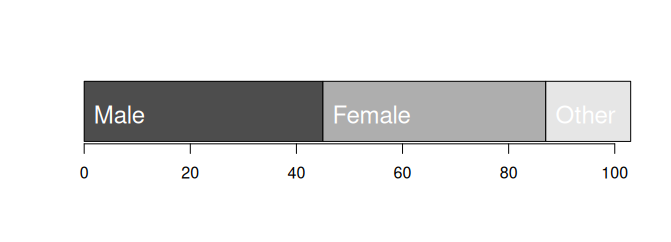
Using a barplot horizontally in R can sometimes be a bit tricky. This is what we want to achieve:
For a vector, it shows the bars next to each other, for a matrix it stacks. That’s how it’s documented, but what does this mean in practice:
x = c("Male","Female","Other")
N = c(45, 42, 16)
df = data.frame(x, N)
df
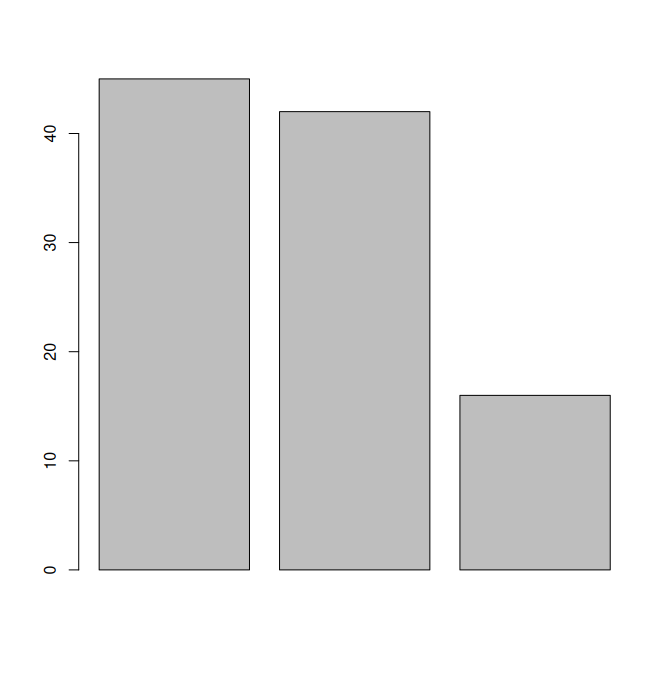
barplot(df$N)
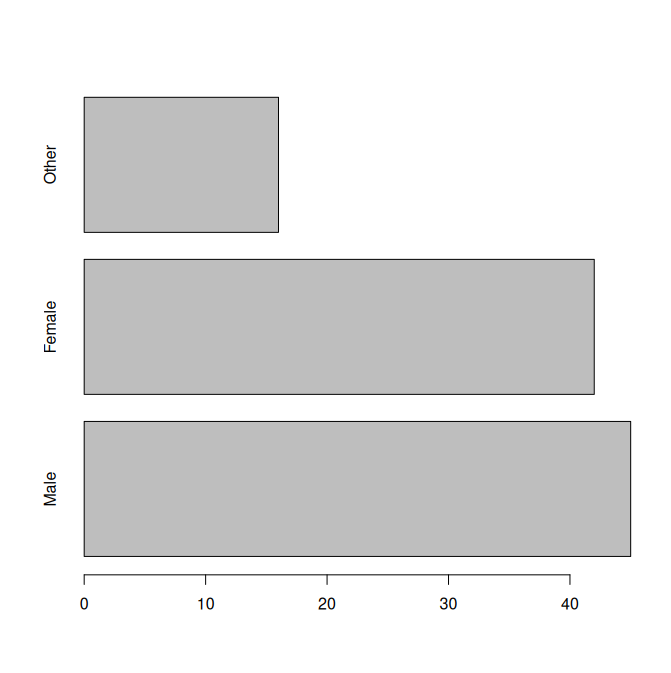
we can turn this with the argument horiz=TRUE and add the names with the names.arg
barplot(df$N, horiz=TRUE, names.arg=df$x)
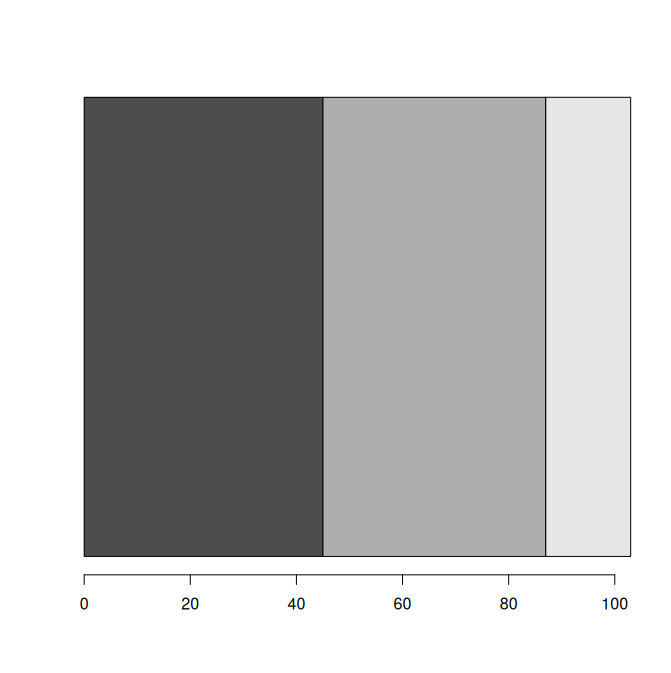
If we add the beside=TRUE for a stacked barplot, nothing happens. That’s because we have a simple vector. We want it as a matrix, and we get our stacked barplot. The names.arg doesn’t work here, because the plot is stacked.
barplot(as.matrix(df$N), horiz=TRUE, beside=FALSE)
OK, we may want to adjust the height of the plot, or directly label the categories with text().
text(c(0, cumsum(df$N)[1:(length(df$N)-1)]), 0.6, df$x, pos=4, col="white", cex=1.5)
Here, cumsum() is the cumulative sum, which I use to get the x coordinates of the labels. 1:(length(df$N)-1) gives me a sequence from 1 to the number of elements in N minus 1. Minus 1, because I want to place the first label at 0, and nothing at the end of the plot. I use c() to combine the 0 with the coordinates I keep. pos=4 positions the labels to the right of the coordinates, and cex controls the size of the text.
Published 4 February 2025