Ethnically homogeneous?

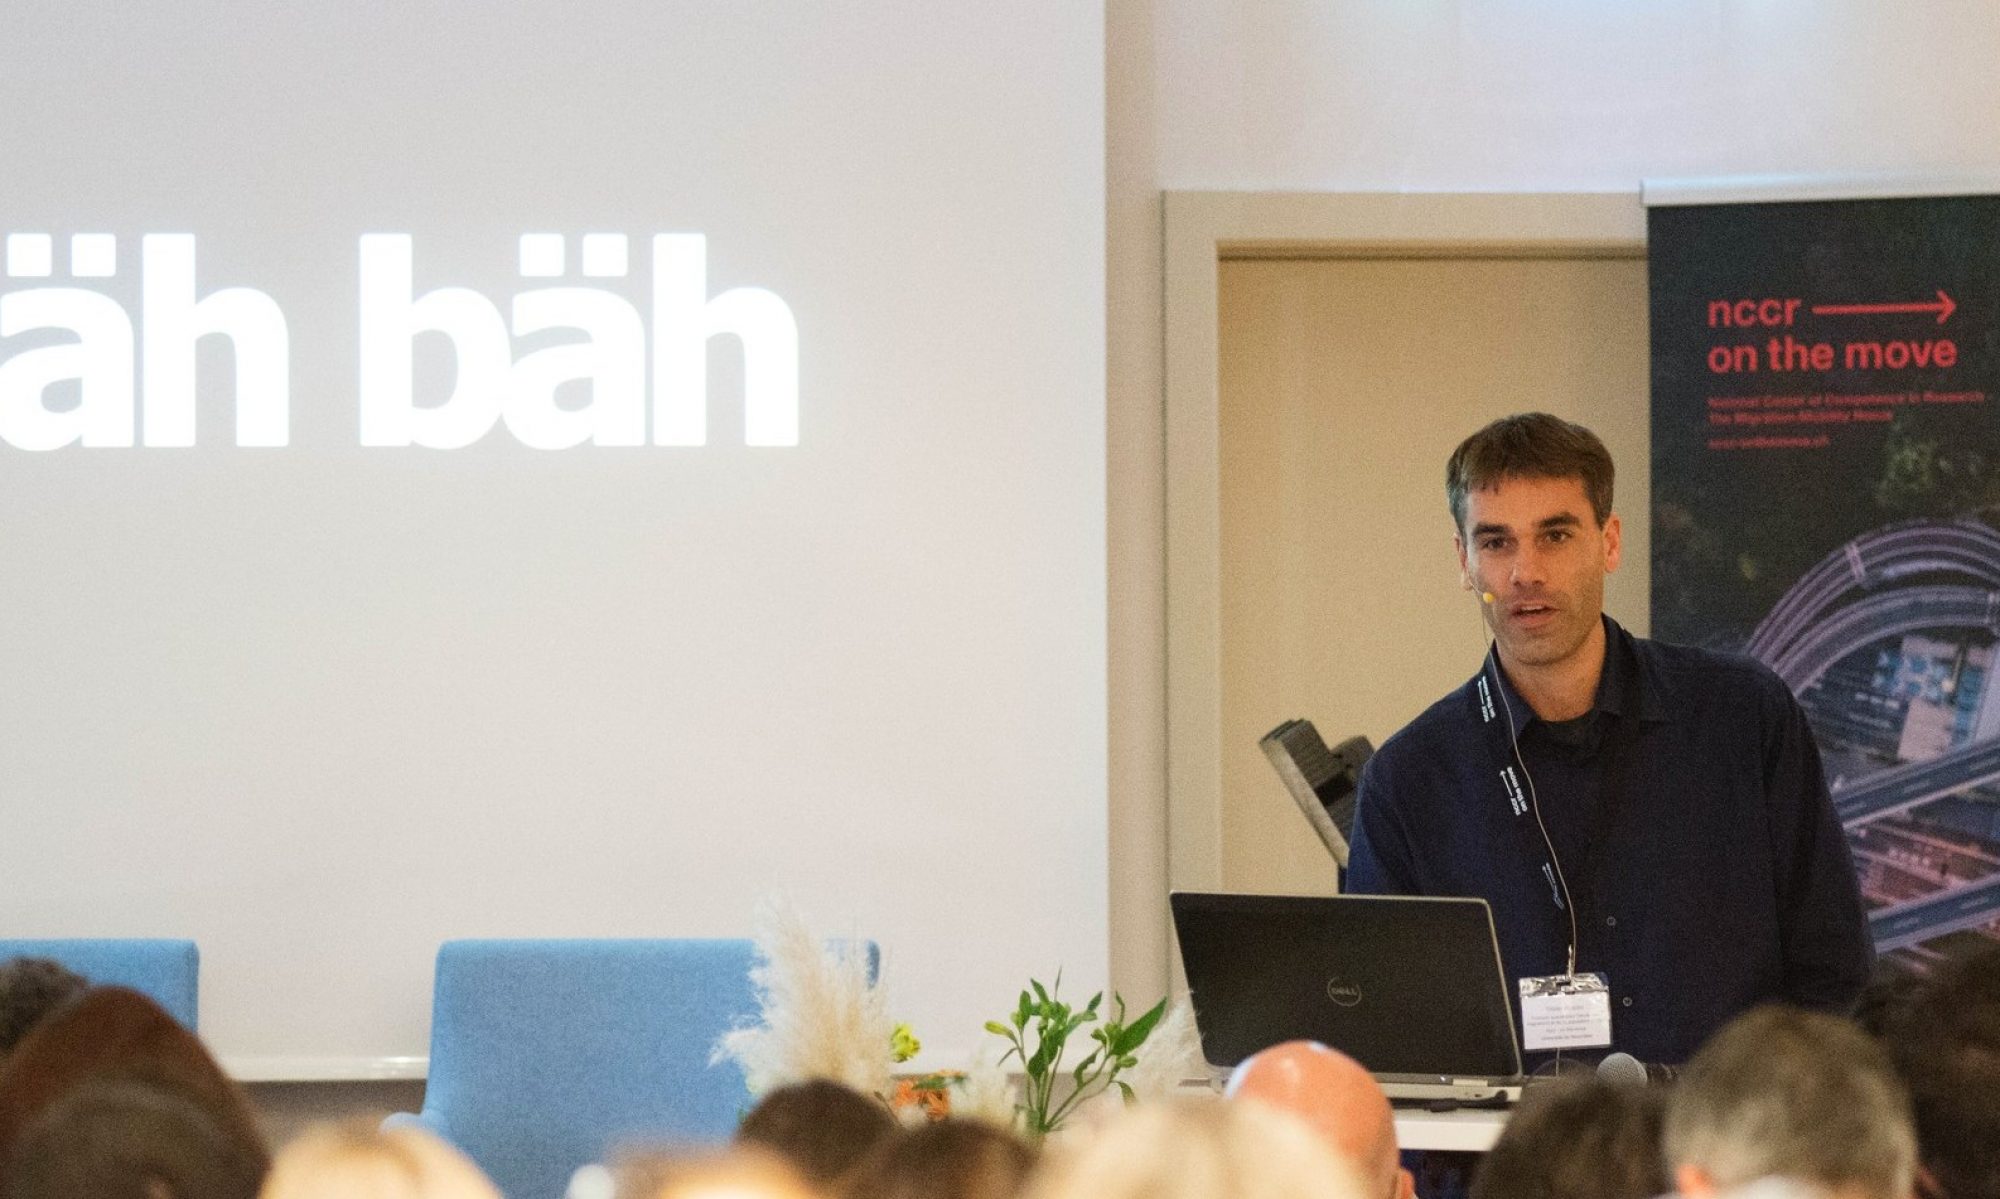
The other day I was at a conference, and Poland was described as ethnically homogeneous. This is not a controversial observation, I guess. The speaker was then using this homogeneity as an ‘explanation’ for current government rhetoric against Muslims in the country — compared to government rhetoric in a more heterogeneous country. This struck me as an odd explanation, after all we all know that ethnic groups and their boundaries are socially constructed. This way, the observation that in a country where the common view is one of internal homogeneity also features exclusivity to ‘others’ seemed trivial if not circular. I’m far from claiming that social construction renders ethnic differences meaningless — the consequences are very real indeed — but as an ‘explanation’ this way I’m struggling a bit.

Ruedin, Didier. 2009. ‘Ethnic Group Representation in a Cross-National Comparison’. The Journal of Legislative Studies 15 (4):335–54. https://doi.org/10.1080/13572330903302448.
Ruedin, Didier. 2013. Why Aren’t They There? The Political Representation of Women, Ethnic Groups and Issue Positions in Legislatures. Colchester: ECPR Press.

A General Class of Social Distance Measures

In a new paper, Graham Brown and Arnim Langer introduce a general class of social distance measures. They follow the general feeling that many measure of diversity and disparity may be closely related by demonstrating how they are all related. By clarifying how these different measures are related, we should find it easier to choose an appropriate measure for the analysis at hand.

The one thing I’m still not convinced is the title of the paper: While they clearly define what they mean by social distance, my sociological training keeps interfering and social distance doesn’t seem fit to express a characteristic of a society. Perhaps it’s easier to talk of the more concrete instances of ethnic diversity, or income disparity.

Brown, Graham K., and Arnim Langer. 2016. ‘A General Class of Social Distance Measures’. Political Analysis, March, mpw002. doi:10.1093/pan/mpw002.

Just How Diverse is the Immigrant Population

Statements that the immigrant population in Western Europe has not only increased but also become more diverse are very commonplace. There’s no apparent reason to doubt this, but just how diverse has the immigrant population become?

Here I use data from Switzerland (because I had them at hand) to quantify immigrant diversity. In the following I use the Herfindahl index to express diversity (available in my R package polrep), not taking into consideration that some groups should probably be considered more different than others. I approach diversity using nationality, and use the large world regions (continents) the Swiss statistical office provides: Europe, Africa, North America, Latin America, Asia, Australia/Oceania, stateless (or missing).

First, here is the foreign population of Switzerland since 1850 as context.

foreign-pop

The diversity changed as follows:
diversity-long

So, yes, the immigrant population has become more diverse. To understand this change, we can look at the different groups of nationalities (continents). Here there are no constraints on the y-axis, allowing us to see relative changes.

diversity-groups

This can be misleading in the sense that small changes can look like radical changes, so the same plot with the y-axis set to 0..1. This way the absolute impact is more visible, such as the continuing dominance of European immigrants.

diversity-groups-abs

Here’s another plot that illustrates that diversity and population size are not quite the same.

diversity-population

Most of the time, however, we’re concerned with more recent development, so here we zoom in, beginning with the overall diversity.

diversity-recent

Here’s a look at the relative changes by group of nationality (continent):

diversity-recent-groups

And here the absolute changes:

diversity-recent-groups-abs

Finally, here are three figures to illustrate that the population of asylum seekers has also become more diverse.

diversity-asylum

Focusing on relative changes by group of nationality (continents) we see significant peaks corresponding to events related to asylum seeking.

diversity-asylum-groups

The absolute figures are perhaps more insightful:

diversity-asylum-groups-abs

All figures also on figshare.