As part of the SOM project, we have expanded the MIPEX indicators backward over time for seven countries. In line with the MIPEX approach, we collected data every few years. This is useful to get an overview of how policies develop over time, but is restrictive for analyses with yearly data. Here are three possibilities to overcome this restriction.
First, we could focus on a smaller set of indicators, and collect data for every year. My earlier analysis suggests that this could be done without serious loss of information, but it would still entail a serious amount of work, especially for countries where relevant legislation covers many legal texts. This would be the correct course of action.
Second, we could impute the missing data. Without additional variables that cover the years in between, multiple imputation is impossible; but we can use manual imputation at the aggregate level. I have used geometric means, but gradual policy changes are in most cases unrealistic, even if they may offer good approximations.
Third, we can use the documentation available to estimate when policy changes occurred. Again, working at the aggregate level, many of the policy changes can be assigned more precisely. There are a few drawbacks to this approach, of course. First, if there were two policy changes within a period, or it is unclear which policy strands are affected by a change in law. It becomes difficult to choose. Fortunately this did not occur often, and I picked the year that – based on the text available – seemed more significant. Second, the documentation available does not cover all changes with sufficient detail. Here I resorted to a heroic assumption: If I observed many changes in a particular year in some of the strands, I assumed that this particular year was also likely to be the year the policies in other strands changed.
Short of collecting new data, does it matter whether I impute my data or look at the documentation? On the one hand, I get a Pearson correlation coefficient of 0.96 (overall, with most individual strands per country correlating at r>0.85). [The SOM asylum indicators are included here, although they turn out the most problematic ones. The biggest discrepancies occur when policies change radically, obviously. This is rare, but they occur particularly in the asylum indicators.]

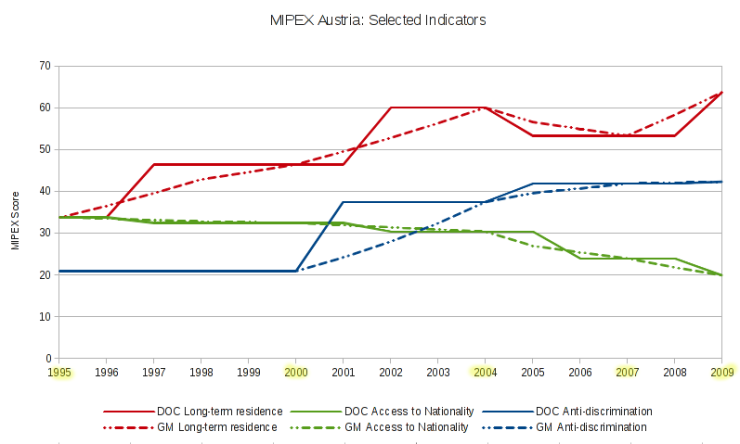
Here is an example comparing three indicators over time for Austria. GM refers to imputation using geometric means; DOC to the use of documentation. For the years in yellow, data are collected. Obviously, both approaches pick up the same trends, but if we are interested in the level of anti-discrimination policy in Austria in 2001, we’d get rather different estimates.

Sociologist. Quantitativist. University of Neuchâtel.
2 Replies to “MIPEX Over Time”